微服务架构日志集中化 安装 EFK (Fluentd ElasticSearch Kibana) 采集nginx日志
本文描述如何通过FEK组合集中化nginx的访问日志。本人更喜欢按顺序来命名,所以使用FEK而不是EFK.
首先在nginx服务器上执行以下操作.
安装ruby
http://blog.csdn.net/chenhaifeng2016/article/details/78678680
安装Fluentd
curl -L https://toolbelt.treasuredata.com/sh/install-redhat-td-agent2.sh | sh
systemctl start td-agent
安装插件
td-agent-gem install fluent-plugin-elasticsearch
td-agent-gem install fluent-plugin-typecast
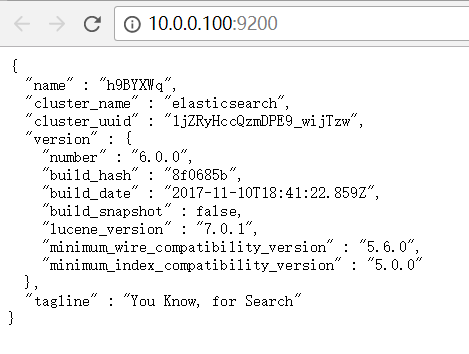
安装ElasticSearch
下载软件包并解压
wget https://artifacts.elastic.co/downloads/elasticsearch/elasticsearch-6.0.0.tar.gz
创建组和用户
groupadd elsearch
useradd elsearch -g elsearch -p elsearch
chown -R elsearch:elsearch /usr/local/src/elsearch
编辑/etc/sysctl.conf
vm.max_map_count=655360
查看一下是否生效
sysctl -p
编辑/etc/security/limits.conf,在文件尾添加以下内容
elsearch soft nofile 65536
elsearch hard nofile 65536
编辑config/elasticsearch.yml,修改以下配置项
network.host: 0.0.0.0
切换到用户elsearch
su elsearch
运行elasticsearch
bin/elasticsearch
如果要以守护进程方式运行加上参数-d
安装Kibana
下载并解压缩文件。
wget https://artifacts.elastic.co/downloads/kibana/kibana-6.0.0-linux-x86_64.tar.gz
修改配置文件config\kibana.yaml
server.port: 5601
server.host: "0.0.0.0"
elasticsearch.url: "http://localhost:9200"
运行kibana
bin/kibana
安装Logstash (这一步非必须)
下载并解压缩文件
wget https://artifacts.elastic.co/downloads/logstash/logstash-6.0.0.tar.gz
创建配置文件logstash.conf
<img src="https://www.centos.bz/wp-content/uploads/2017/12/2-16.png" alt="" />
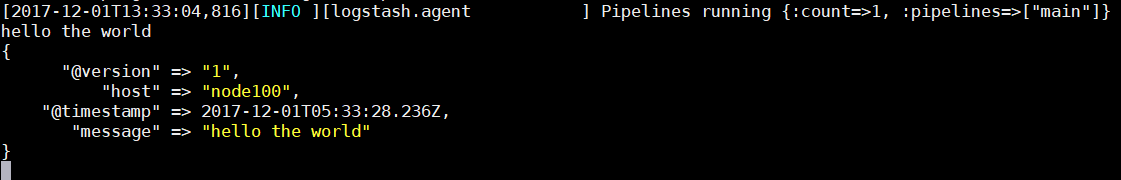
运行./logstash -f logstash.conf
输入hello the world
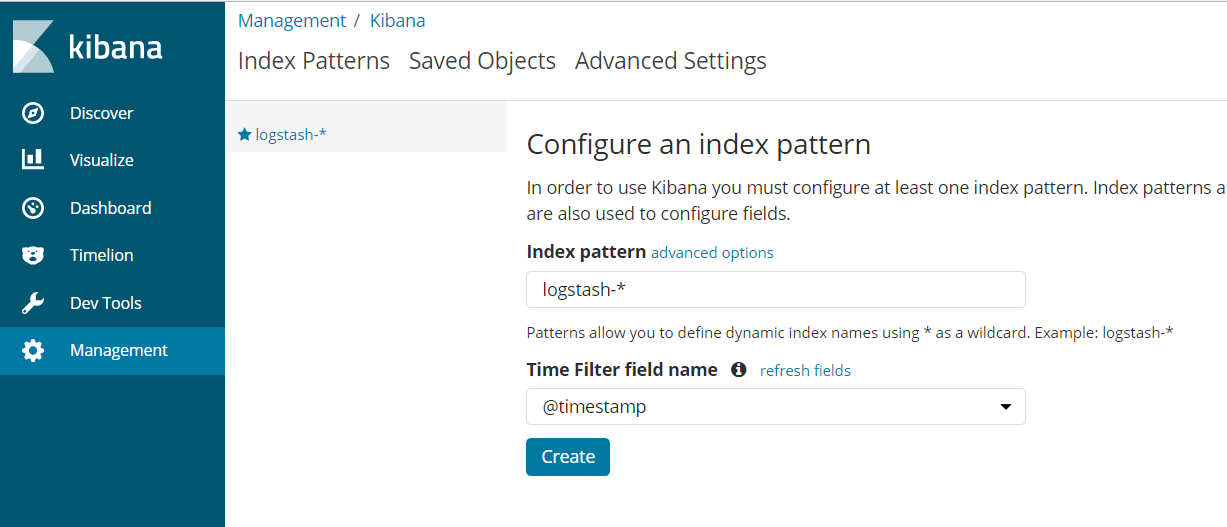
在kibana创建索引模式
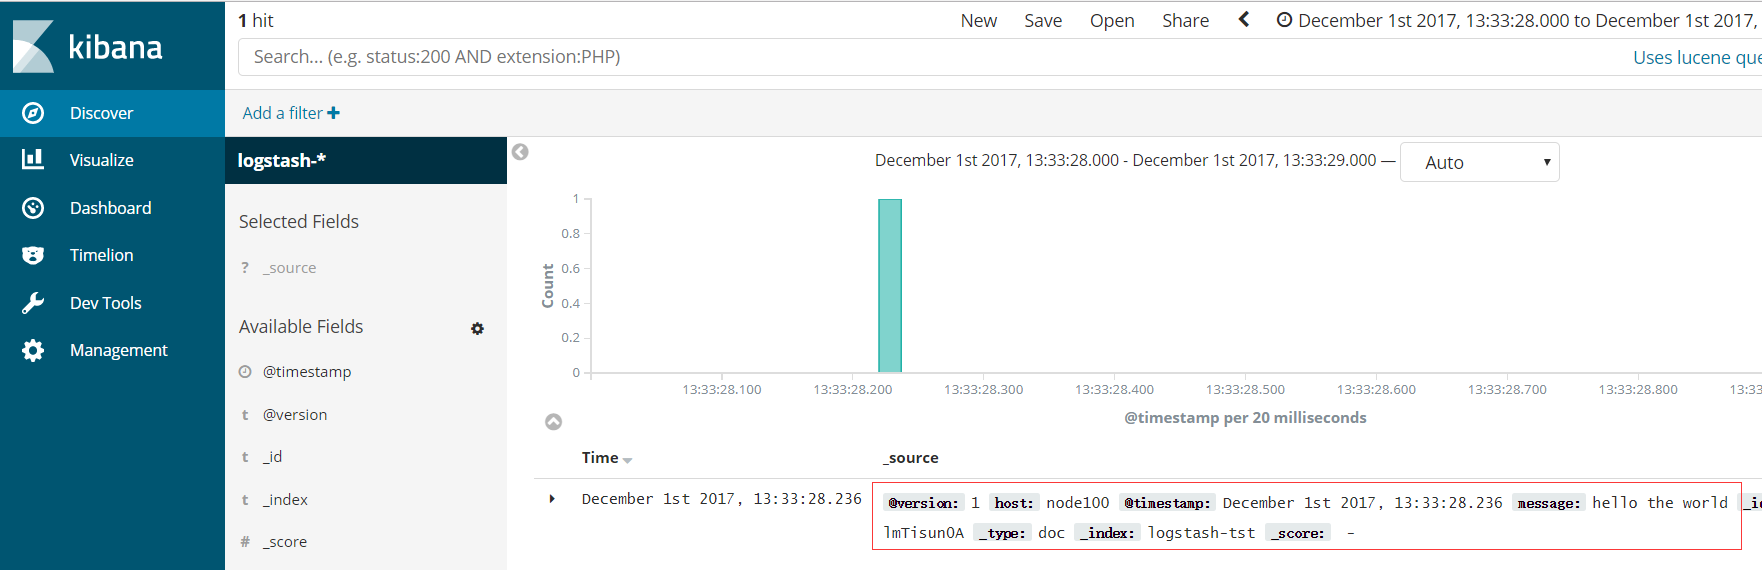
在kibana的Discover界面就可以看到信息了
接下来配置fluentd
编辑配置文件/etc/td-agent/td-agent.conf
[plain] view plain copy
<source>
  @type tail
  path /usr/local/nginx/logs/access.log
  pos_file /usr/local/nginx/logs/access.log.pos

  tag nginx.access
  format /^(?<host>[^ ]*) [^ ]* (?<user>[^ ]*)
(?<time>[^
]*)\] "(?<method>\S+)(?: +(?<path>[^ ]*) +\S*)?" (?<code>[^ ]*) (?<size>[^ ]*)(?: "(?<referer>[^\"]*)" "(?<agent>[^\"]*)")?$/
  time_format %d/%b/%Y:%H:%M:%S %z
</source>
<match nginx.access>
  @type elasticsearch
  host localhost
  port 9200
#  index_name fluentd
  flush_interval 10s
  logstash_format true
#  typename fluentd
</match>
在/usr/local/nginx/logs/下面创建access.log.pos文件
touch access.log.pos

chmod a+rw access.log.pos
重启fluentd
systemctl restart fluentd
修改nginx.conf, 更改日志格式
[plain] view plain copy
log_format  main  '$remote_addr $http_host [$time_local] "$request" $status $body_bytes_sent "$http_referer" "$http_user_agent"';
重启nginx
nginx -s reload
通过浏览器访问nginx
查看fluentd的日志
tail -f /var/log/td-agent/td-agent.log
说明fluent读取nginx的access.log成功并发给了elasticsearch.
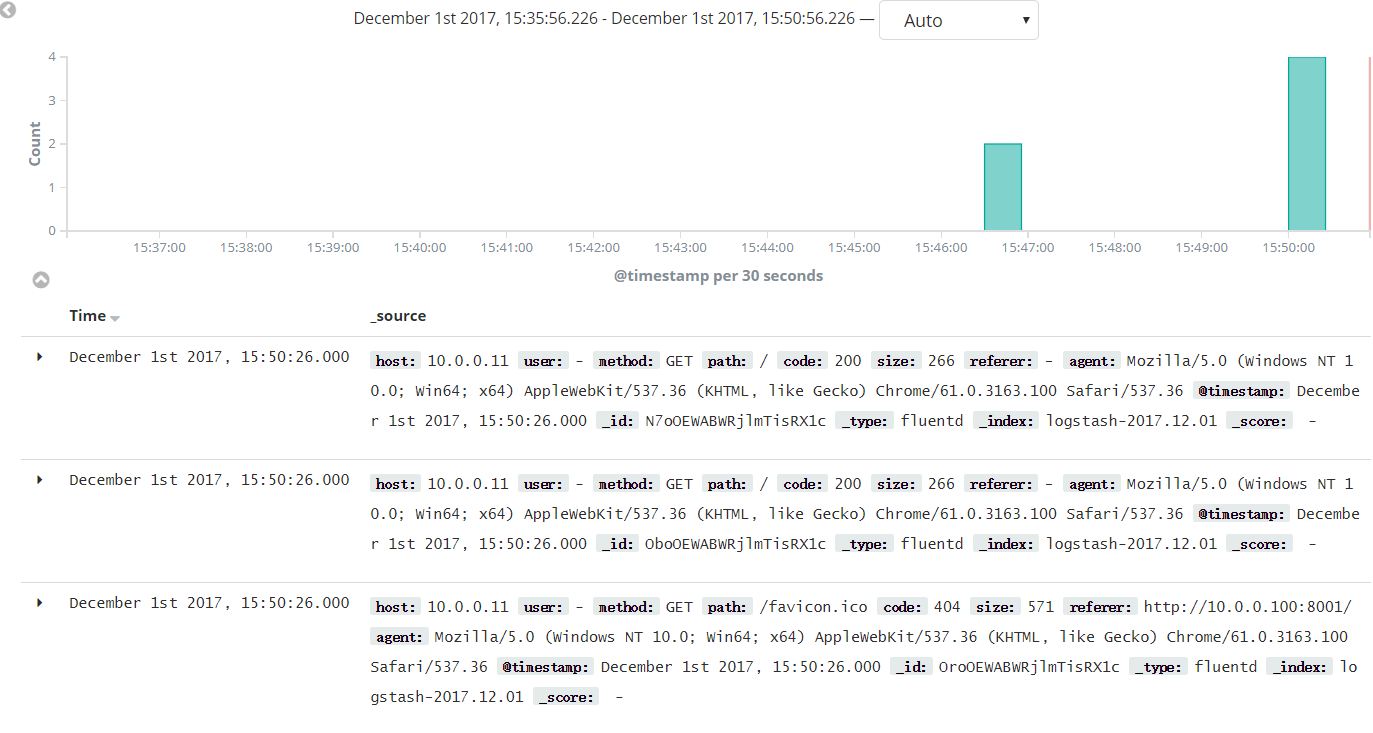
在kibana查看日志
参考资料
正则表达式:http://fluentular.herokuapp.com/
http://blog.csdn.net/qq_27252133/article/details/53520416
补充说明:
采集端可以使用logstash, filebeat, 也可以使用fluentbit。因为fluent是CNCF的项目,所以只是为了了解一下。
标签云
-
WgetVPSNginxWordPressOfficeCrontabAppleInnoDBMemcacheKubernetesTomcatRedisPHPDNSLighttpdKVMPutty监控ApacheRedhatiPhoneSVNCentosGITWiresharkOpenStackMacOSKotlinCDN集群squidDebianWPSAnsibleVsftpd代理服务器WindowsSnmpSambaMySQLSecureCRTKloxoSaltStackUbuntuOpenVZIptablesLinuxYumCurl备份FirewalldRsyncIOSJenkinsPostfixSocketVagrantTensorFlowVirtualminFlaskSSHSystemdMongodbDeepinAndroidSwiftZabbixSwarmShellLVMMariaDB缓存BashSQLAlchemyPostgreSQLCactiGooglePythonSupervisorFlutterGolangDockerVirtualbox容器NFSLUAHAproxyTcpdump部署Openresty