Kubernetes之利用prometheus监控K8S集群
prometheus它是一个主动拉取的数据库,在K8S中应该展示图形的grafana数据实例化要保存下来,使用分布式文件系统加动态PV,但是在本测试环境中使用本地磁盘,安装采集数据的agent使用DaemonSet来部署,DaemonSet的特性就是在每个node上部署一个服务进程,这一切都是自动的部署。
此处只讲如何用prometheus来监控K8S集群,关于prometheus的知识参考官方文档。
部署前提: 准备好所需要的文件
$ ls -l
Prometheus/prometheus#:/data/Prometheus/prometheus# ls -l
total 28
drwxr-xr-x 2 root root 4096 Jan 15 02:53 grafana
drwxr-xr-x 2 root root 4096 Jan 15 03:11 kube-state-metrics
-rw-r--r-- 1 root root   60 Jan 14 06:48 namespace.yaml
drwxr-xr-x 2 root root 4096 Jan 15 03:22 node-directory-size-metrics
drwxr-xr-x 2 root root 4096 Jan 15 03:02 node-exporter
drwxr-xr-x 2 root root 4096 Jan 15 02:55 prometheus
drwxr-xr-x 2 root root 4096 Jan 15 02:37 rbac

$ ls grafana/
grafana-configmap.yaml  grafana-core-deployment.yaml  grafana-import-dashboards-job.yaml  grafana-pvc-claim.yaml  grafana-pvc-volume.yaml  grafana-service.yaml

$ ls prometheus/
configmap.yaml  deployment.yaml  prometheus-rules.yaml  service.yaml
grafana和 prometheus 都是部署文件,node-exporter、kube-state-metrics、node-directory-size-metrics这三个是采集器,相当于prometheus的agent
文件准备好了,现在开始一步一步来部署:
1、创建所需Namespace
因为prometheus 部署的所有的deploy、pod、svc都是在monitoring完成的,所以需要事先创建之。
 $ cat namespace.yaml
 apiVersion: v1
 kind: Namespace
 metadata:
  name: monitoring

 $ kubectl create -f namespace.yaml
 namespace "monitoring" created
2、创建grafana的pv、 pvc
grafana# cat grafana-pvc-volume.yaml
kind: PersistentVolume
apiVersion: v1
metadata:
  name: grafana-pv-volume
  labels:
    type: local
spec:
  storageClassName: grafana-pv-volume
  capacity:
    storage: 10Gi
  accessModes:
    - ReadWriteOnce
  persistentVolumeReclaimPolicy: Recycle
  hostPath:
    path: "/data/volume/grafana"

grafana# cat grafana-pvc-claim.yaml
kind: PersistentVolumeClaim
apiVersion: v1
metadata:
  name: grafana-pvc-volume
  namespace: "monitoring"
spec:
  accessModes:
    - ReadWriteOnce
  resources:
    requests:
      storage: 5Gi
  storageClassName: grafana-pv-volume

$ kubectl create -f grafana/grafana-pvc-volume.yaml -f grafana/grafana-pvc-claim.yaml
persistentvolume "grafana-pv-volume" created
persistentvolumeclaim "grafana-pvc-volume" created

$ kubectl get pvc -n monitoring
NAME          STATUS           VOLUME       CAPACITY   ACCESS MODES   STORAGECLASS     AGE
grafana-pvc-volume   Bound     grafana-pv-volume   10Gi       RWO     grafana-pv-volume   52s

状态bound已绑定到了 grafana-pv-volume
3、创建grafana应用,这些应用都是第三方的,都会有自已的配置,通过configmap来定义
grafana# ls
grafana-configmap.yaml  grafana-core-deployment.yaml  grafana-import-dashboards-job.yaml  grafana-pvc-claim.yaml  grafana-pvc-volume.yaml  grafana-service.yaml
grafana# kubectl create -f ./    #grafana目录下所有文件都创建
configmap "grafana-import-dashboards" created
deployment "grafana-core" created
job "grafana-import-dashboards" created
service "grafana" created


grafana# kubectl get deployment,pod -n monitoring
NAME                  DESIRED   CURRENT   UP-TO-DATE   AVAILABLE   AGE
deploy/grafana-core   1         1         1            0           1m

NAME                              READY     STATUS              RESTARTS   AGE
po/grafana-core-9c7f66868-7q8lx   0/1       ContainerCreating   0          1m
运行po/grafana-core 容器时会下载镜像: grafana/grafana:4.2.0
grafana创建的应用 简单的自已描述了下:
      grafana-pv-volume=/data/volume/grafana =10G
      grafana-pvc-volume=5G--->grafana-pv-volume
      ---configmap=grafana-import-dashboards
      Job=grafana-import-dashboards

      Deployment=grafana-core     replicas: 1  containers=grafana-core   mount:  grafana-pvc-volume:/var
      service=grafana     port: 3000  = nodePort: 30161     (3000是grafana服务的默认端口)
4、现在grafana的核心应用已部署好了,现在来部署prometheus的RBAC
prometheus/rbac# ls
grant_serviceAccount.sh  prometheus_rbac.yaml
#先创建RBAC文件:
prometheus/rbac# kubectl create -f prometheus_rbac.yaml
clusterrolebinding "prometheus-k8s" created
clusterrolebinding "kube-state-metrics" created
clusterrole "kube-state-metrics" created
serviceaccount "kube-state-metrics" created
clusterrolebinding "prometheus" created
clusterrole "prometheus" created
serviceaccount "prometheus-k8s" created
prometheus/rbac#
5、创建prometheus的deloyment,service
prometheus/prometheus# ls
configmap.yaml  deployment.yaml  prometheus-rules.yaml  service.yaml
prometheus/prometheus#
在configmap.yaml中要注意的是在1.7以后,获取cadvsion监控pod等的信息时,用的是kubelet的4194端口,
注意以下这段:这是采集cadvision信息,必须是通过kubelet的4194端口,所以Kubelet必须监听着,4194部署了cadvsion来获取pod中容器信息
prometheus/prometheus#cat configmap.yaml
 # https://github.com/prometheus/prometheus/blob/master/documentation/examples/prometheus-kubernetes.yml#L37
      - job_name: 'kubernetes-nodes'
        tls_config:
          ca_file: /var/run/secrets/kubernetes.io/serviceaccount/ca.crt
        bearer_token_file: /var/run/secrets/kubernetes.io/serviceaccount/token
        kubernetes_sd_configs:
          - role: node
        relabel_configs:
          - source_labels: [__address__]
            regex: '(.*):10250'
            replacement: '${1}:10255'
            target_label: __address__
      - job_name: 'kubernetes-cadvisor'
        scheme: https
        tls_config:
          ca_file: /var/run/secrets/kubernetes.io/serviceaccount/ca.crt
        bearer_token_file: /var/run/secrets/kubernetes.io/serviceaccount/token
        kubernetes_sd_configs:
          - role: node
        relabel_configs:
        - action: labelmap
          regex: __meta_kubernetes_node_label_(.+)
        - target_label: __address__
          replacement: kubernetes.default.svc.cluster.local:443
        - source_labels: [__meta_kubernetes_node_name]
          regex: (.+)
          target_label: __metrics_path__
          replacement: /api/v1/nodes/${1}:4194/proxy/metrics

      # https://github.com/prometheus/prometheus/blob/master/documentation/examples/prometheus-kubernetes.yml#L79
prometheus-rules.yaml 这是它的发现规则文件
deployment.yaml service.yaml 这两个是部署的文件, deployment部署中资源限制建议放大一点
现在部署prometheus目录下所有文件:
prometheus/prometheus# kubectl create -f ./
configmap "prometheus-core" created
deployment "prometheus-core" created
configmap "prometheus-rules" created
service "prometheus" created
prometheus/prometheus#

prometheus/prometheus# kubectl get deployment,pod -n monitoring
NAME                     DESIRED   CURRENT   UP-TO-DATE   AVAILABLE   AGE
deploy/grafana-core      1         1         1            1           16m
deploy/prometheus-core   1         1         1            1           1m

NAME                                  READY     STATUS    RESTARTS   AGE
po/grafana-core-9c7f66868-wm68j       1/1       Running   0          16m
po/prometheus-core-6dc6777c5b-5nc7j   1/1       Running   0          1m
prometheus应用的部署,简单描述下创建的内容:
1
2
    Deployment= prometheus-core   replicas: 1    containers=prometheus   image: prom/prometheus:v1.7.0    containerPort: 9090(webui)
    Service    name: prometheus   NodePort-->port: 9090 -webui
6、prometheus部署完了现在来部署它的agent,也就是采集器:
Prometheus/prometheus# ls node-directory-size-metrics/
daemonset.yaml
Prometheus/prometheus# ls kube-state-metrics/
deployment.yaml  service.yaml
Prometheus/prometheus# ls node-exporter/
exporter-daemonset.yaml  exporter-service.yaml
Prometheus/prometheus#
#其中两个用的是daemonset

Prometheus/prometheus# kubectl create -f node-exporter/ -f kube-state-metrics/ -f node-directory-size-metrics/
daemonset "prometheus-node-exporter" created
service "prometheus-node-exporter" created
deployment "kube-state-metrics" created
service "kube-state-metrics" created
daemonset "node-directory-size-metrics" created
Prometheus/prometheus#

Prometheus/prometheus# kubectl get deploy,pod,svc -n monitoring
NAME                        DESIRED   CURRENT   UP-TO-DATE   AVAILABLE   AGE
deploy/grafana-core         1         1         1            1           26m
deploy/kube-state-metrics   2         2         2            2           1m
deploy/prometheus-core      1         1         1            1           11m

NAME                                     READY     STATUS    RESTARTS   AGE
po/grafana-core-9c7f66868-wm68j          1/1       Running   0          26m
po/kube-state-metrics-694fdcf55f-bqcp8   1/1       Running   0          1m
po/kube-state-metrics-694fdcf55f-nnqqd   1/1       Running   0          1m
po/node-directory-size-metrics-n9wx7     2/2       Running   0          1m
po/node-directory-size-metrics-ppscw     2/2       Running   0          1m
po/prometheus-core-6dc6777c5b-5nc7j      1/1       Running   0          11m
po/prometheus-node-exporter-kchmb        1/1       Running   0          1m
po/prometheus-node-exporter-lks5m        1/1       Running   0          1m

NAME                           TYPE        CLUSTER-IP      EXTERNAL-IP   PORT(S)          AGE
svc/grafana                    NodePort    10.254.231.25   <none>        3000:30161/TCP   26m
svc/kube-state-metrics         ClusterIP   10.254.156.51   <none>        8080/TCP         1m
svc/prometheus                 NodePort    10.254.239.90   <none>        9090:37318/TCP   10m
svc/prometheus-node-exporter   ClusterIP   None            <none>        9100/TCP         1m
Prometheus/prometheus#

--------
Prometheus/prometheus# kubectl get pod -o wide -n monitoring
NAME                                  READY     STATUS    RESTARTS   AGE       IP             NODE
prometheus-node-exporter-kchmb        1/1       Running   0          4m        10.3.1.16      10.3.1.16
prometheus-node-exporter-lks5m        1/1       Running   0          4m        10.3.1.17      10.3.1.17

#这两个是exporter,用的是daemonset 分别在这两个node上运行了。这样就可以采集到所有数据了。
如上部署完成,以下是用自已的话简单描述下:
 node-exporter/exporter-daemonset.yaml 文件:
       DaemonSet=prometheus-node-exporter
          containers: name: prometheus-node-exporter    image: prom/node-exporter:v0.14.0
          containerPort: 9100   hostPort: 9100  hostNetwork: true    #它用的是主机的9100端口

        Prometheus/prometheus/node-exporter# kubectl get  daemonset,pod -n monitoring
        NAME                             DESIRED   CURRENT   READY     UP-TO-DATE   AVAILABLE   NODE SELECTOR   AGE
        ds/node-directory-size-metrics   2         2         2         2            2           <none>          16h
        ds/prometheus-node-exporter      2         2         2         2            2           <none>          16h
           因为它是daemonset,所以相应的也会运行着两个Pod: prometheus-node-exporter

      Service=prometheus-node-exporter   clusterIP: None   port: 9100  type: ClusterIP   #它没有clusterIP

    # kubectl get  service -n monitoring
    NAME                       TYPE        CLUSTER-IP      EXTERNAL-IP   PORT(S)          AGE
    prometheus-node-exporter   ClusterIP   None            <none>        9100/TCP         16h
kube-state-metrics/deployment.yaml 文件:
      Deployment=kube-state-metrics replicas: 2   containers-->name: kube-state-metrics  image: gcr.io/google_containers/kube-state-metrics:v0.5.0
                 containerPort: 8080

      Service     name: kube-state-metrics   port: 8080  #没有映射
                                 #kubectl get deployment,pod,svc -n monitoring
            NAME                        DESIRED   CURRENT   UP-TO-DATE   AVAILABLE   AGE
            deploy/kube-state-metrics   2         2         2            2           16h

            NAME                                     READY     STATUS    RESTARTS   AGE
            po/kube-state-metrics-694fdcf55f-2mmd5   1/1       Running   0          11h
            po/kube-state-metrics-694fdcf55f-bqcp8   1/1       Running   0          16h

            NAME                           TYPE        CLUSTER-IP      EXTERNAL-IP   PORT(S)          AGE
            svc/kube-state-metrics         ClusterIP   10.254.156.51   <none>        8080/TCP         16h
node-directory-size-metrics/daemonset.yaml 文件:
        #因为是daemonset,所以未定义replicas数量,直接运行在每个node之上,但是它没有创建service
      DaemonSet : name: node-directory-size-metrics
                  containers-->name: read-du  image: giantswarm/tiny-tools   mountPath: /mnt/var   mountPath: /tmp
                  containers--> name: caddy    image: dockermuenster/caddy:0.9.3 containerPort: 9102
                               mountPath: /var/www   hostPath /var

        kubectl get daemonset,pod,svc -n monitoring
        NAME                             DESIRED   CURRENT   READY     UP-TO-DATE   AVAILABLE   NODE SELECTOR   AGE
        ds/node-directory-size-metrics   2         2         2         2            2           <none>          16h


        NAME                                     READY     STATUS    RESTARTS   AGE
        po/node-directory-size-metrics-n9wx7     2/2       Running   0          16h
        po/node-directory-size-metrics-ppscw     2/2       Running   0          16h

        NAME                           TYPE        CLUSTER-IP      EXTERNAL-IP   PORT(S)          AGE
                     没有node-directory-size-metrics的service
到此 prometheus算是部署完成了,最后来看下它暴露的端口:
Prometheus/prometheus# kubectl get svc -o wide -n monitoring
NAME                       TYPE        CLUSTER-IP      EXTERNAL-IP   PORT(S)          AGE       SELECTOR
grafana                    NodePort    10.254.231.25   <none>        3000:30161/TCP   31m       app=grafana,component=core
kube-state-metrics         ClusterIP   10.254.156.51   <none>        8080/TCP         6m        app=kube-state-metrics
prometheus                 NodePort    10.254.239.90   <none>        9090:37318/TCP   16m       app=prometheus,component=core
prometheus-node-exporter   ClusterIP   None            <none>        9100/TCP         6m        app=prometheus,component=node-exporter
Prometheus/prometheus#
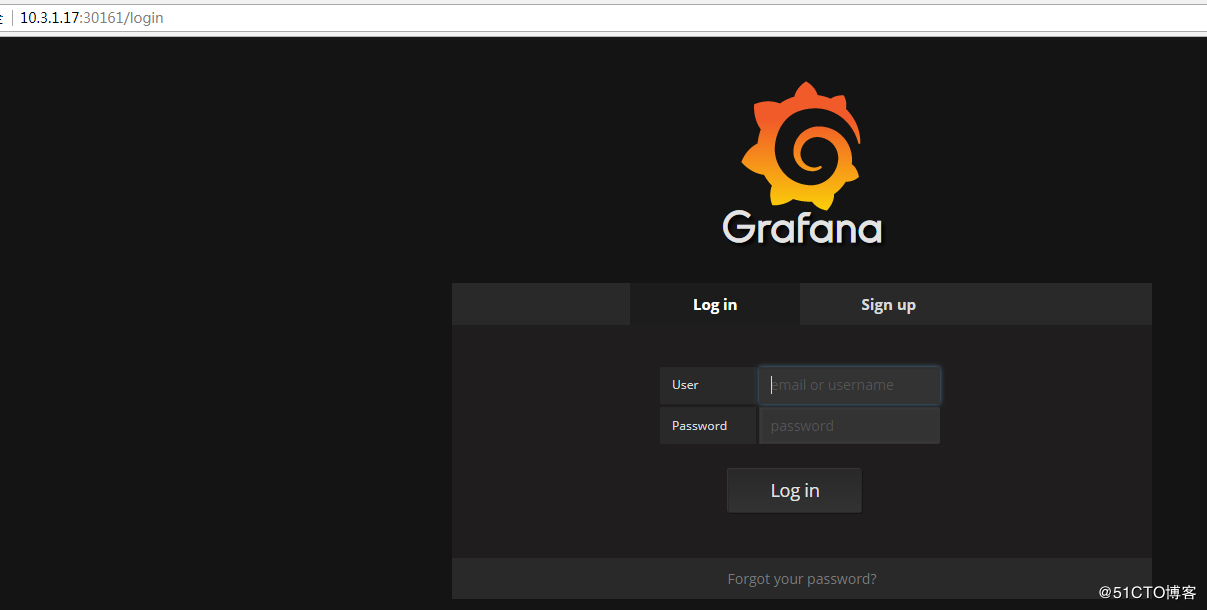
7、访问、使用prometheus
如上可以看到grafana的端口号是30161,NodeIP:30161 就可以打开grafana,默认admin/admin
登录后,添加数据源:
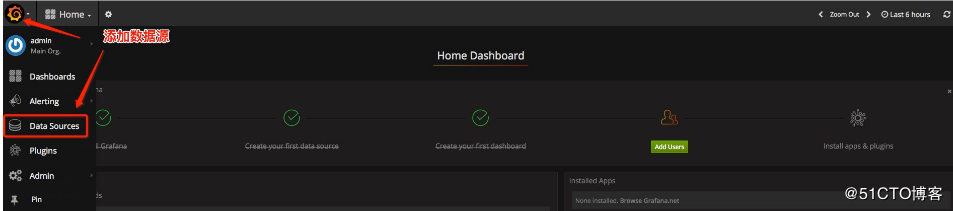
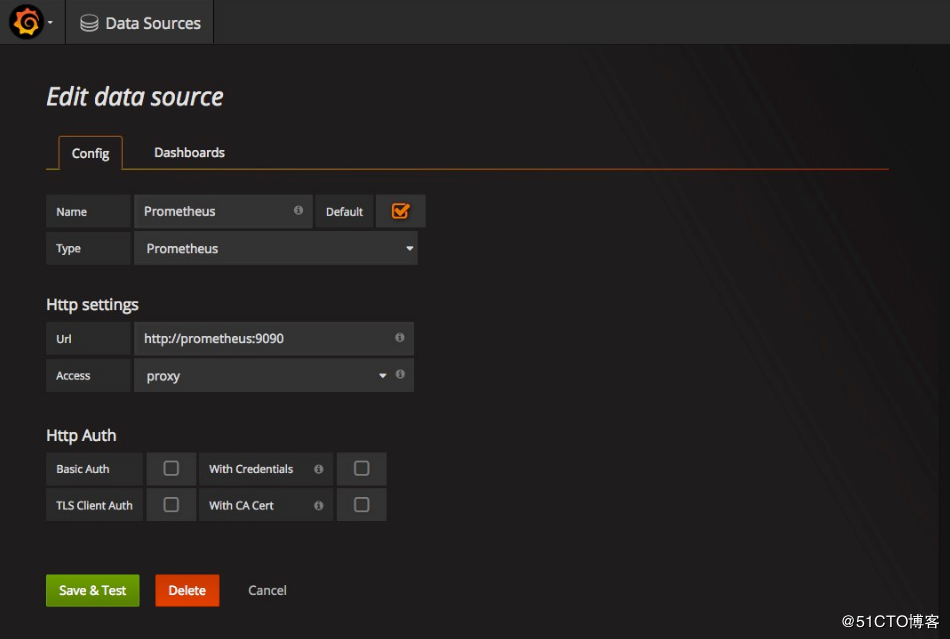
添加Prometheus的数据源:
将Prometheus的作为数据源的相关参数如下图所示:
添加完后,导入模板文件:

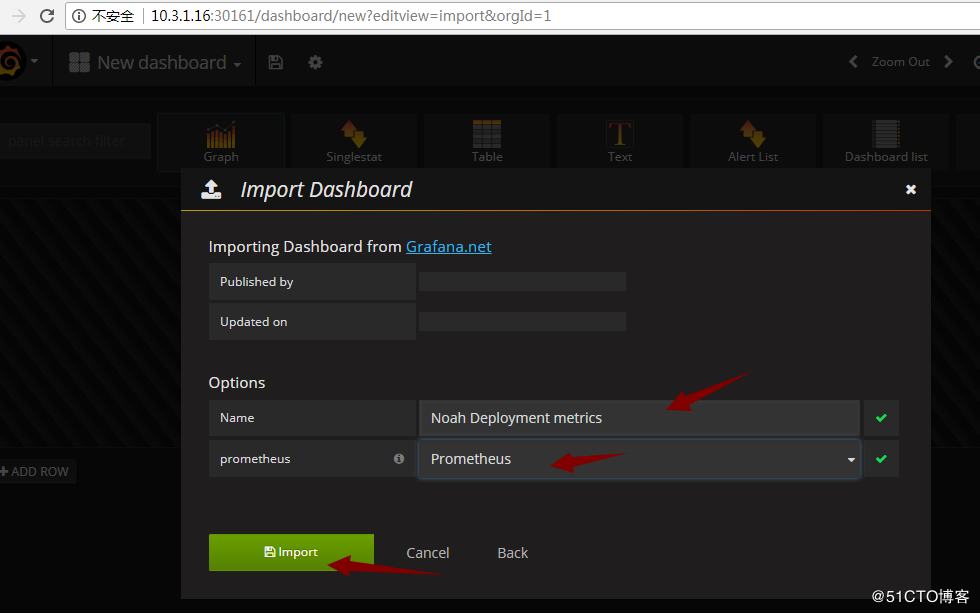

部署完成。
标签云
-
NginxOpenStack备份DebianAndroidSVNCactiZabbixPostfixWiresharkInnoDBWgetJenkinsVirtualboxAnsibleGITTomcatPostgreSQLMariaDBUbuntuSwiftKloxoBashMongodbLVMAppleDockerMySQLKotlinSystemdWPSHAproxyGolangMemcacheYumTcpdump监控CentosLUAsquid容器SwarmTensorFlowRedisFlutterGoogleSupervisorCurlSocketMacOSRedhatFirewalldIOSWindowsVsftpdOpenrestyOpenVZSecureCRTNFSSaltStackVagrantShellWordPressIptablesCDNLinuxDNSVirtualmin部署iPhoneSQLAlchemyOfficeVPSCrontabRsyncSambaSnmpLighttpdApache缓存PHPSSHDeepinKubernetesPython集群Putty代理服务器KVMFlask